PIDSnap

PID trend signatures

What each loop problem looks like on a trend, drawn as computed SVG rather than an artist's impression. Free to reuse under CC BY 4.0 — copy the embed code under any figure, or download the file, and keep the attribution line intact.

Every figure is generated from the equation it is named after, so a stiction sawtooth is a stick-slip integration and an over-tuned loop really overshoots by the damping ratio its caption describes. They are line drawings, not screenshots, which is what makes them usable in a slide, a handout or a wiki page.

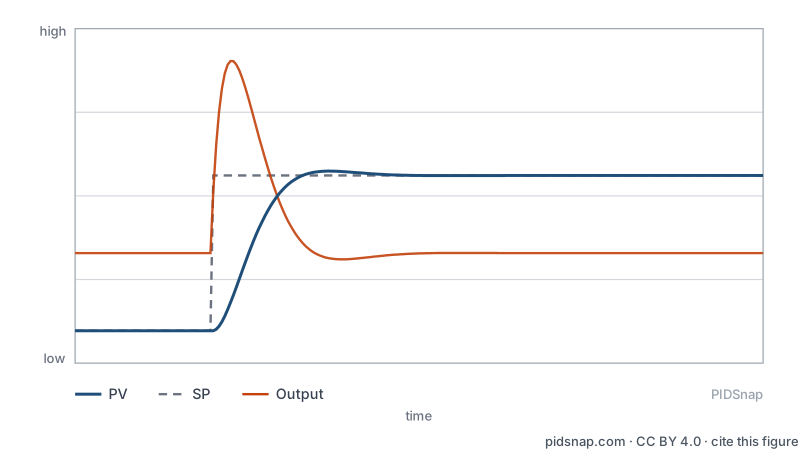
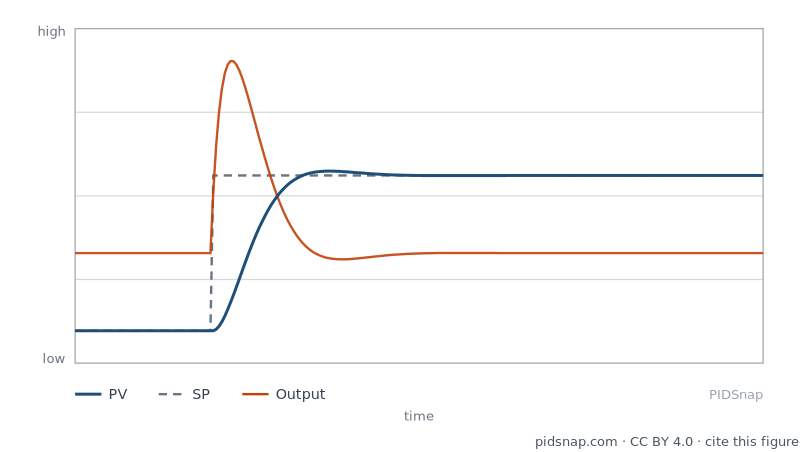
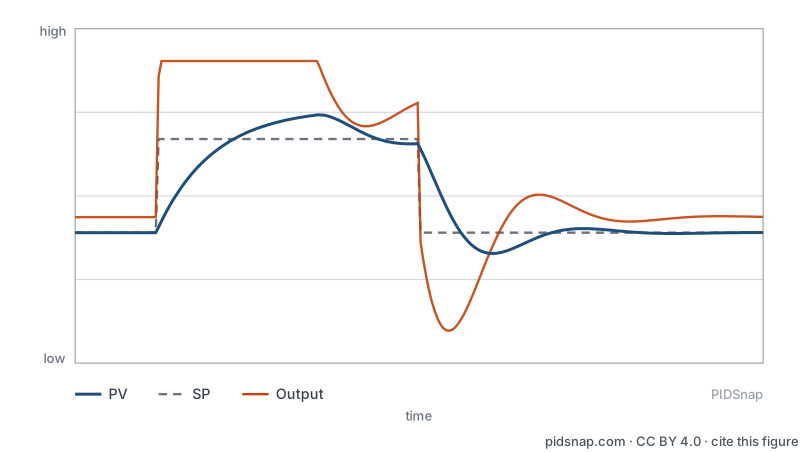
A healthy control loop response Trend of a healthy PID loop: after a setpoint step the process variable overshoots slightly and settles within two peaks. high low PV SP Output PIDSnap time
Trend of a healthy PID loop: after a setpoint step the process variable overshoots slightly and settles within two peaks. One small overshoot, a second much smaller peak, then flat. The output moves decisively and then stops moving. This is what every stopping criterion in a PIDSnap session is describing.
Embed this figure

A healthy control loop response — released under CC BY 4.0. Keep the attribution line so the citation survives wherever the figure ends up.

<img src="https://pidsnap.com/signatures/healthy.svg"
     alt="Trend of a healthy PID loop: after a setpoint step the process variable overshoots slightly and settles within two peaks."
     width="800" height="452" loading="lazy">
<a href="https://pidsnap.com/signatures#healthy">PIDSnap</a>
SVG · PNG

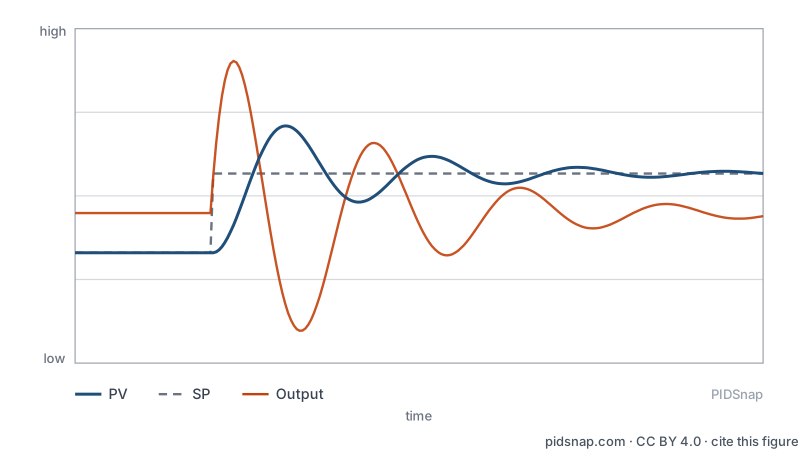
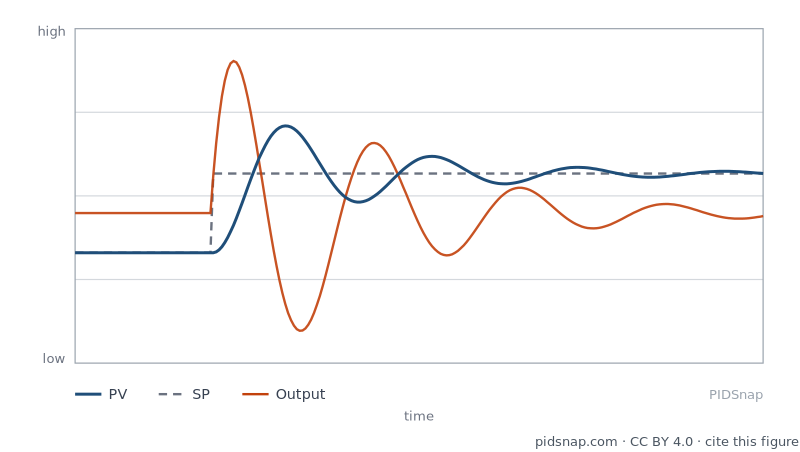
An over-tuned loop hunting after a setpoint change Trend of an over-tuned PID loop: the process variable hunts for several cycles after a setpoint change before settling. high low PV SP Output PIDSnap time
Trend of an over-tuned PID loop: the process variable hunts for several cycles after a setpoint change before settling. Four or more peaks that shrink slowly. The output mirrors the process variable and swings just as hard. The oscillation decays, which is what separates a tuning problem from a mechanical limit cycle — stiction cycles do not decay.
Embed this figure

An over-tuned loop hunting after a setpoint change — released under CC BY 4.0. Keep the attribution line so the citation survives wherever the figure ends up.

<img src="https://pidsnap.com/signatures/tuning_too_aggressive.svg"
     alt="Trend of an over-tuned PID loop: the process variable hunts for several cycles after a setpoint change before settling."
     width="800" height="452" loading="lazy">
<a href="https://pidsnap.com/signatures#tuning_too_aggressive">PIDSnap</a>
SVG · PNG

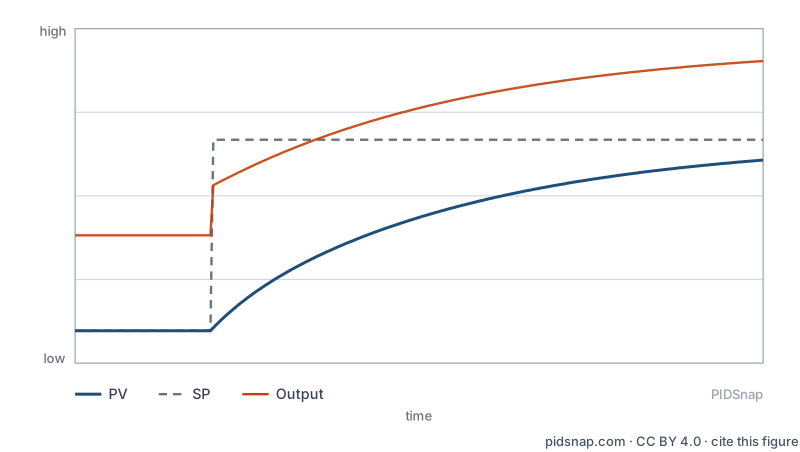
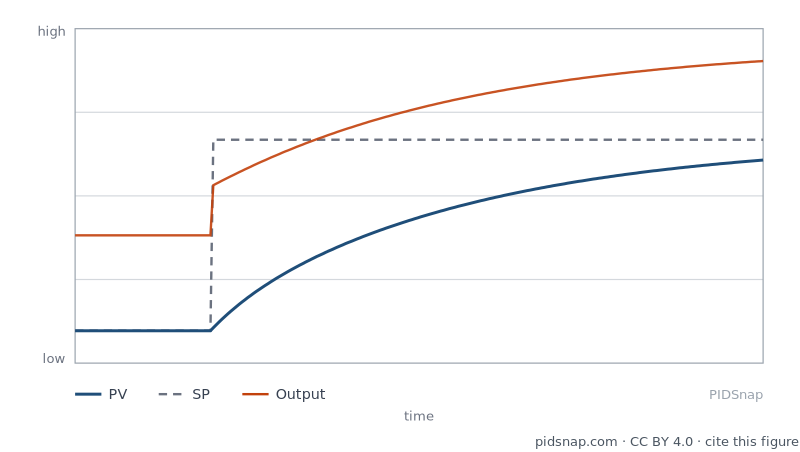
A sluggish control loop crawling towards setpoint Trend of a sluggish PID loop: the process variable creeps towards setpoint and has still not arrived by the end of the window. high low PV SP Output PIDSnap time
Trend of a sluggish PID loop: the process variable creeps towards setpoint and has still not arrived by the end of the window. No overshoot at all, and an offset that is still closing when the trend ends. A loop that never overshoots is not a well-tuned loop, it is a slow one. The output barely moves, which is the giveaway that the controller is not being asked to do much.
Embed this figure

A sluggish control loop crawling towards setpoint — released under CC BY 4.0. Keep the attribution line so the citation survives wherever the figure ends up.

<img src="https://pidsnap.com/signatures/tuning_too_sluggish.svg"
     alt="Trend of a sluggish PID loop: the process variable creeps towards setpoint and has still not arrived by the end of the window."
     width="800" height="452" loading="lazy">
<a href="https://pidsnap.com/signatures#tuning_too_sluggish">PIDSnap</a>
SVG · PNG

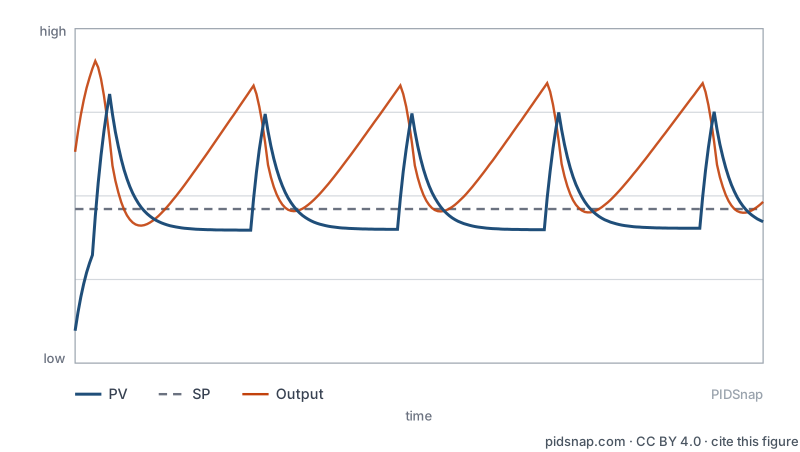
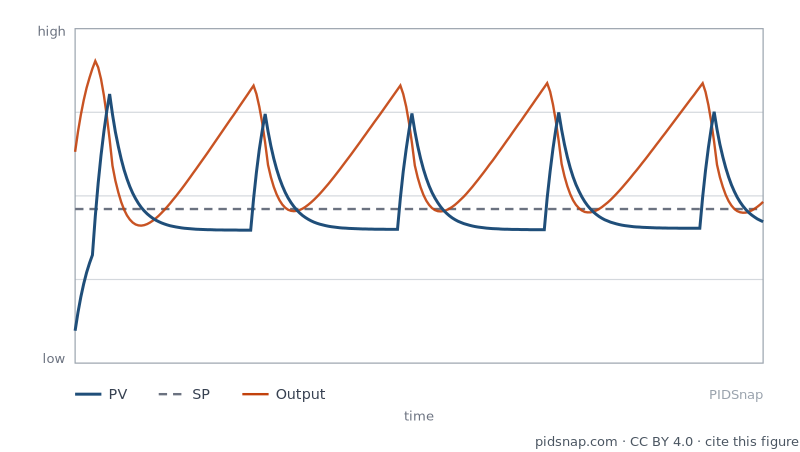
Valve stiction producing a limit cycle Trend showing valve stiction: the controller output ramps smoothly while the process variable moves in abrupt steps, producing a limit cycle that does not decay. high low PV SP Output PIDSnap time
Trend showing valve stiction: the controller output ramps smoothly while the process variable moves in abrupt steps, producing a limit cycle that does not decay. A sawtooth or square-cornered cycle on the process variable against a smooth, slowly ramping output. The cycle amplitude stays constant instead of decaying. Put the loop in manual and the cycle stops — that single test separates stiction from every tuning problem.
Embed this figure

Valve stiction producing a limit cycle — released under CC BY 4.0. Keep the attribution line so the citation survives wherever the figure ends up.

<img src="https://pidsnap.com/signatures/valve_stiction.svg"
     alt="Trend showing valve stiction: the controller output ramps smoothly while the process variable moves in abrupt steps, producing a limit cycle that does not decay."
     width="800" height="452" loading="lazy">
<a href="https://pidsnap.com/signatures#valve_stiction">PIDSnap</a>
SVG · PNG

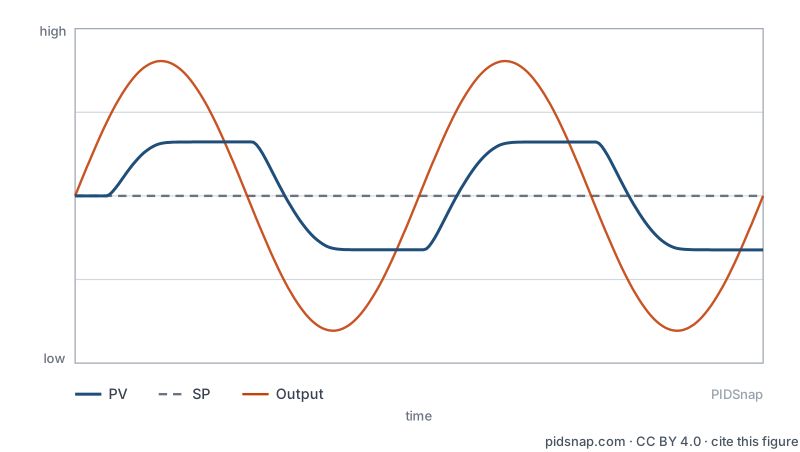
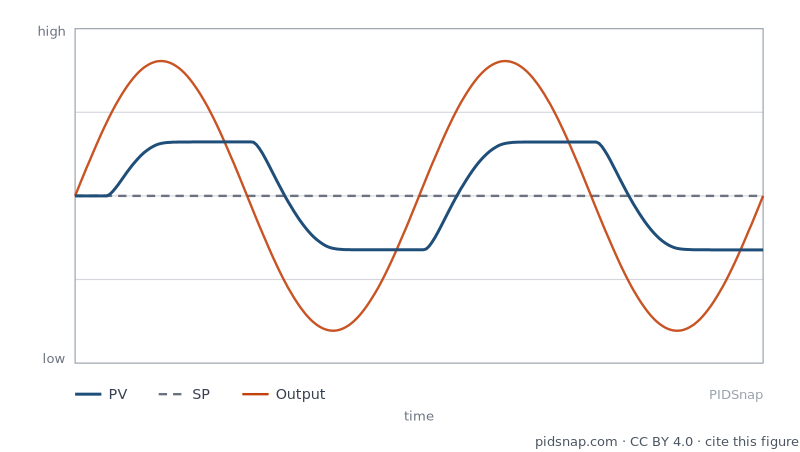
Backlash and deadband in a valve linkage Trend showing backlash: the process variable stays flat while the controller output reverses, then follows once the deadband has been taken up. high low PV SP Output PIDSnap time
Trend showing backlash: the process variable stays flat while the controller output reverses, then follows once the deadband has been taken up. Flat spots on the process variable exactly where the output changes direction. The width of the flat spot is the size of the deadband. This is lost motion in the linkage or the actuator coupling, not a tuning problem.
Embed this figure

Backlash and deadband in a valve linkage — released under CC BY 4.0. Keep the attribution line so the citation survives wherever the figure ends up.

<img src="https://pidsnap.com/signatures/hysteresis_backlash.svg"
     alt="Trend showing backlash: the process variable stays flat while the controller output reverses, then follows once the deadband has been taken up."
     width="800" height="452" loading="lazy">
<a href="https://pidsnap.com/signatures#hysteresis_backlash">PIDSnap</a>
SVG · PNG

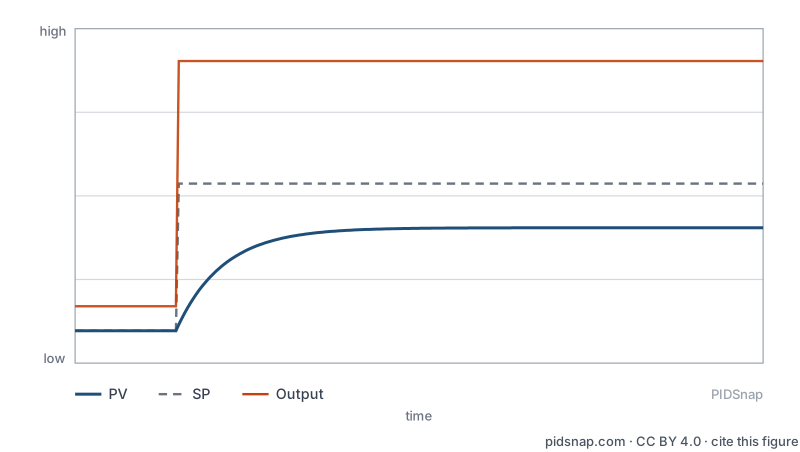
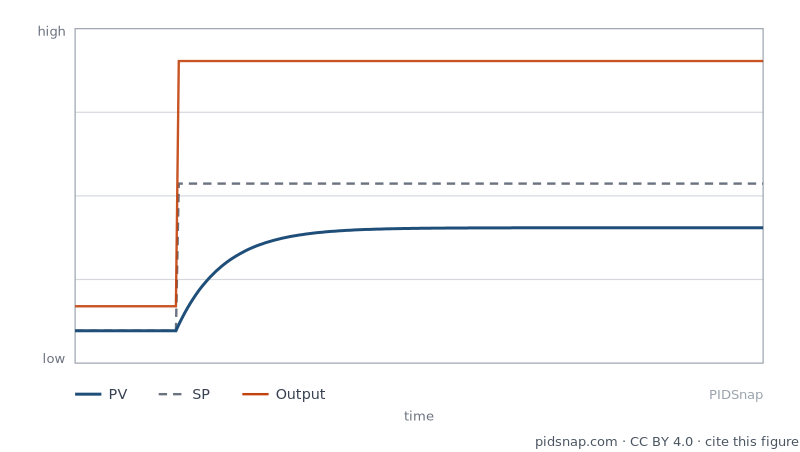
Controller output saturated at its limit Trend showing controller output saturation: the output sits flat against its upper limit while the process variable never reaches setpoint. high low PV SP Output PIDSnap time
Trend showing controller output saturation: the output sits flat against its upper limit while the process variable never reaches setpoint. A perfectly flat output line at 100% — real controller outputs are never that still — with a persistent gap between the process variable and the setpoint. While the output is on a limit the controller is not in control, and no tuning change reaches the process.
Embed this figure

Controller output saturated at its limit — released under CC BY 4.0. Keep the attribution line so the citation survives wherever the figure ends up.

<img src="https://pidsnap.com/signatures/output_saturation.svg"
     alt="Trend showing controller output saturation: the output sits flat against its upper limit while the process variable never reaches setpoint."
     width="800" height="452" loading="lazy">
<a href="https://pidsnap.com/signatures#output_saturation">PIDSnap</a>
SVG · PNG

Integral windup causing overshoot after saturation Trend showing integral windup: after a period with the output saturated, the process variable overshoots badly and the output stays at its limit long after the setpoint has been reached. high low PV SP Output PIDSnap time
Trend showing integral windup: after a period with the output saturated, the process variable overshoots badly and the output stays at its limit long after the setpoint has been reached. The output pinned at a limit for a stretch, then a large overshoot when the setpoint is finally reached, and an output that refuses to come off the limit until the error has been negative for a while. The integral term accumulated while the controller could not act on it.
Embed this figure

Integral windup causing overshoot after saturation — released under CC BY 4.0. Keep the attribution line so the citation survives wherever the figure ends up.

<img src="https://pidsnap.com/signatures/integral_windup.svg"
     alt="Trend showing integral windup: after a period with the output saturated, the process variable overshoots badly and the output stays at its limit long after the setpoint has been reached."
     width="800" height="452" loading="lazy">
<a href="https://pidsnap.com/signatures#integral_windup">PIDSnap</a>
SVG · PNG

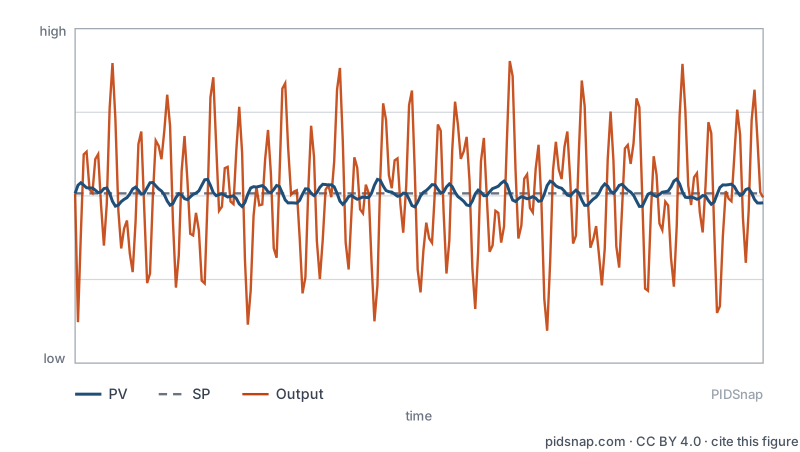
Derivative action amplifying measurement noise Trend showing noise amplification: a modest amount of noise on the process variable appears on the controller output magnified many times over. high low PV SP Output PIDSnap time
Trend showing noise amplification: a modest amount of noise on the process variable appears on the controller output magnified many times over. The output is noisier than the measurement, not quieter. Every wiggle on the process variable appears larger on the output. The valve is being asked to chase turbulence. On a flow, pressure or speed loop this is almost always derivative action that should not be there.
Embed this figure

Derivative action amplifying measurement noise — released under CC BY 4.0. Keep the attribution line so the citation survives wherever the figure ends up.

<img src="https://pidsnap.com/signatures/noise_amplification.svg"
     alt="Trend showing noise amplification: a modest amount of noise on the process variable appears on the controller output magnified many times over."
     width="800" height="452" loading="lazy">
<a href="https://pidsnap.com/signatures#noise_amplification">PIDSnap</a>
SVG · PNG

Using these figures in a control textbook or course

The SVGs scale without pixelation and the traces are labelled PV, SP and Output, so they drop into lecture notes unchanged. If you need the underlying shape as data rather than a picture, the same signatures drive the classification on every diagnosis page, where each one is tied to the checks that confirm or rule it out.

Run a free PIDSnap check on this loop

Two photos, thirty seconds, no signup. The pre-flight check finds the structural problems that no amount of tuning will fix — before you touch the controller.

Start a free check